Make sure it is the only Xdebug node or you will experience issues.
PHPStorm Setup
Before setting up the Web server, ensure your PHP Installation is correctly configured. Note: These instructions may differ slightly in the Mac variant.
PHP Interpreter Configuration
Go to File → Settings (or Ctrl-Alt-S in Windows)
Select ‘PHP’ and you will see the CLI Interpreter section (which may or may not be blank).
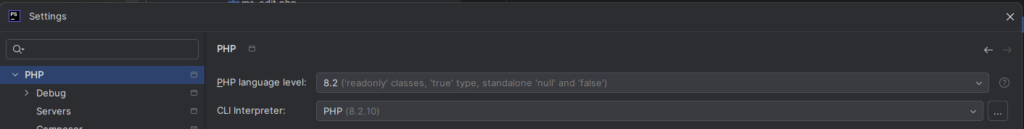
Click the ‘…’ icon on the right and navigate to your PHP installation.
Make sure you verify the PHP configuration file referred to here is the same one you just added Xdebug configuration to!
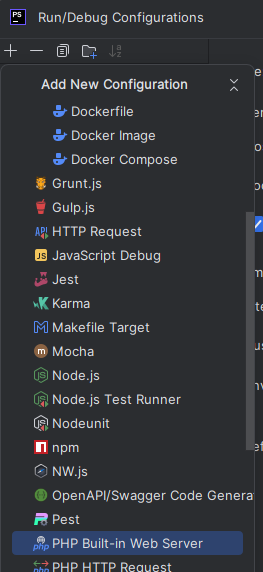
Web Server Configuration
PHP Storm needs to be set up to run your web server and point it to your code base.
For a ‘WordPress’ installation, it relies on redirections from any given path to the main ‘index.php’ file. This is achieved within the PHPStorm installation by the use of a ‘router’ script.
The router script is where requests are sent first to ensure they are sent to the appropriate place.
On a traditional web server, this would be performed using a ‘.htaccess’ file in Apache, or a ‘.user.ini’ file in NGinx.
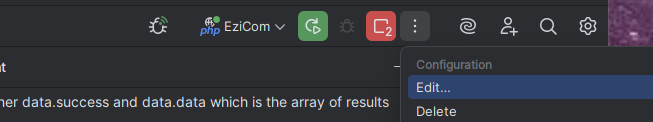
Use the ellipsis icon in the top right of the PHP Storm IDE to enter the debugging configuration area.
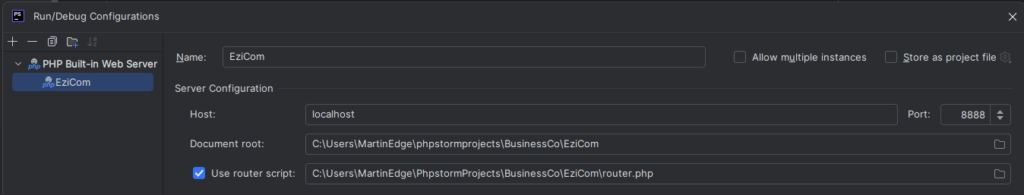
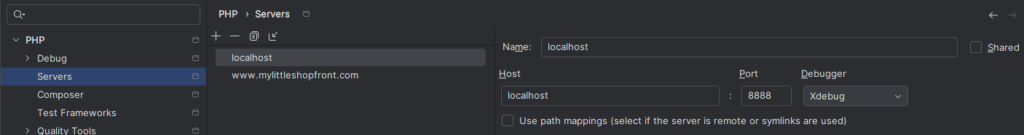
Within the web server configuration, only a handful of items require values.
- Name – Vanity name for the server
- Host – How the server is accessed
- Port – Which port the request will come in on.
- The document root – the base path to the web application.
- The router script – as mentioned earlier, it routes all requests to a single entry point.
When working with others in a development environment where the configuration of the application indicates what the expected ‘URL’ is (WordPress, for example, stores the hostname of the site in its ‘wp_options’ table), all developers should use these same port so that the URLs generated for the application that read this table are created in a way that your setup works with.
Ensure Debugging Requests are captured.
When a request is forwarded via XDebug, it needs to be mapped from the remote code that the server can see, and where that exists on your file system. That’s how the two are paired, so you can step through code.
By default, PHP Storm will ignore connections that it does not know to reduce noise. This setting is excellent to keep enabled after you have your mapping correct. It is located under PHP → Debug.
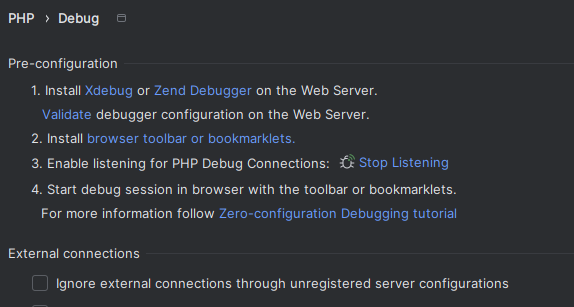
When setting this up for the first time, disable this setting, so the new request coming from your local web server can be caught and you can configure the appropriate mappings.
Mapping configuration is located under PHP → Servers.
When this is complete, you can re-check ‘ignore’ to prevent random requests from interrupting your work.
Remember this flag! Many developers have been caught trying to figure out why debugging is not working; when it is, it’s just ignored.
WordPress Setup
As mentioned earlier in the document, WordPress generates the URLs used throughout the platform by using the wp_options setting (generally settings 2 and 3, if I recall correctly).
When creating a staging or test environment, ensure it is updated to navigate the application cleanly. You will only forget this once! ![]()
Testing and use
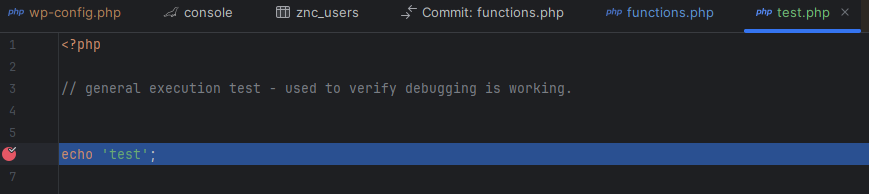
To test everything is working together, create a ‘test.php’ file in the wp-admin directory. Simply put:
echo 'test';
In the file and click on the line number to set a ‘break point’.
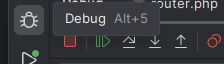
Start your web server and ensure connections are listening for the debugger.

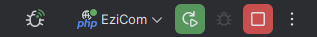
The ‘Play’ starts the web server. The ‘bug’ with the ‘cross’ or ‘beam’ indicates whether it is active or not.
Navigate to your test page: https://localhost:8888/wp-admin/test.php in this instance:
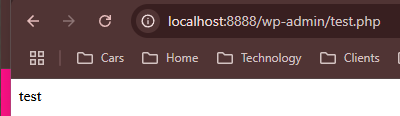
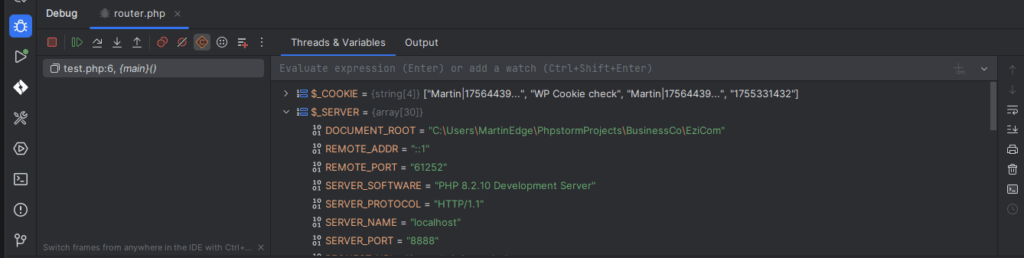
Before the ‘test’ is executed on the screen, you will notice that PHPStorm signals attention and the ‘echo’ in your script is highlighted.
Debugging steps are managed from the ‘Debug’ panel, which should have automatically opened as soon as the breakpoint was hit. There are tutorials on the internet on how this panel works, but fundamentally, you will be looking for
Play – continue executing until finished or we hit the next break point.
Step In – Move inside the method being called
Step Over – Move over the method being called
Step Out – Move out of the method being called
Stop – Abort the request entirely (the web page you have called will not complete rendering – useful if the process you are testing would damage data if the request were permitted to continue).
Once you understand how to control debugging steps within your script, you can place breakpoints anywhere in your test to see exactly what is happening.
The real game changer is being able to see what variables are set and what they are set to at the time! You will notice the ‘Threads and Variables’ section, which shows you precisely what is active.
Hopefully, this guide assists you in debugging your application and accelerates your development!